English language enforcement tightens, capacity holds steady

U.S. spot market
On June 25, the U.S. government resumed enforcing English language proficiency for truck drivers, making it an out-of-service violation if drivers fail a roadside test. Despite speculation that this could tighten truckload capacity to the point of shifting the balance of supply and demand, we believe the impact will be minimal.
Even at peak enforcement, language-related violations affected a very small percentage of drivers, approximately 0.3% in 2013. The regions with notably high numbers of violations occurred in U.S.-Mexico border zones, which remain exempt under current federal guidance.
Additionally, U.S. truck drivers already have to pass a test to get a commercial license, and enforcement of the roadside test may be inconsistent given its subjectivity. Perfect fluency in English is not required. Inspectors are supposed to ensure drivers can sufficiently navigate the roads and understand officials they may need to interact with.
Enforcement so far has remained limited and not at a scale that would materially impact truck capacity. While some violations have been issued, they align with expectations based on historical data. The recent tightening in capacity appears to be driven by seasonal factors tied to end-of-month/quarter activity and the July 4 holiday.
With a still oversupplied market and many carriers already adapting to language compliance expectations, some drivers will certainly be impacted but we do not anticipate this rule change will meaningfully tip the scales of capacity.
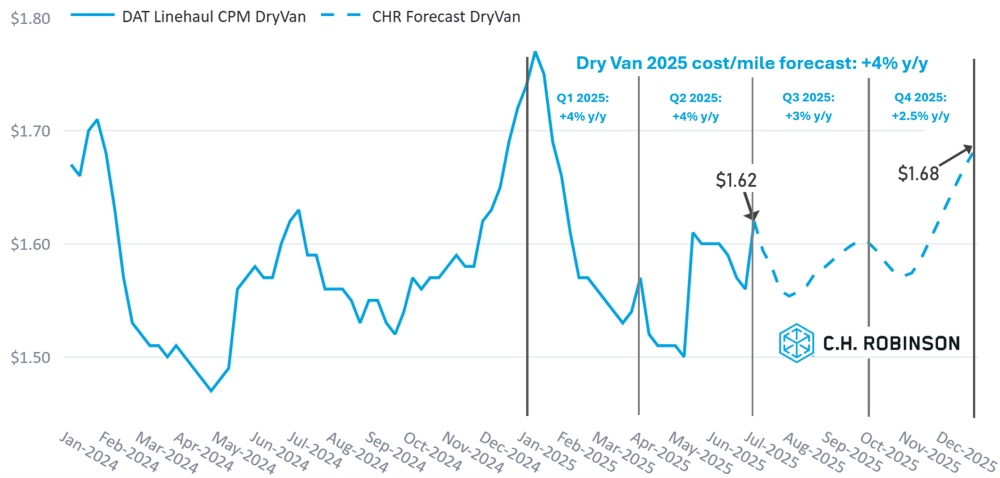
U.S. spot market forecast: Dry van truckload
The C.H. Robinson 2025 dry van cost-per-mile forecast remains at +4% for the year. As is seasonally typical, rates in Q3 are expected to soften after the peak of produce and beverage seasons.
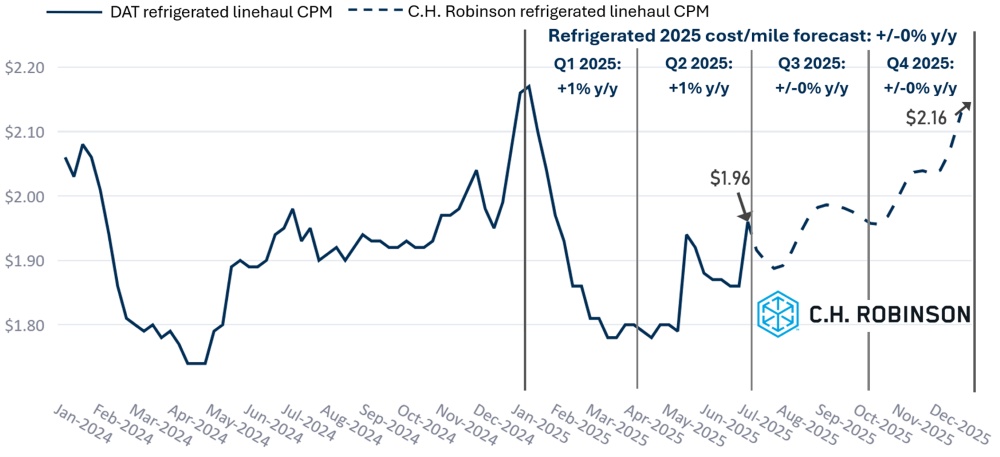
U.S. spot market forecast: Refrigerated truckload
The C.H. Robinson 2025 refrigerated van cost-per-mile forecast remains flat y/y.
For-hire capacity forecast
If the current pace of U.S. carrier attrition continues, this is our projected timeline for when capacity would return to historical norms—no sooner than November of this year and possibly longer.
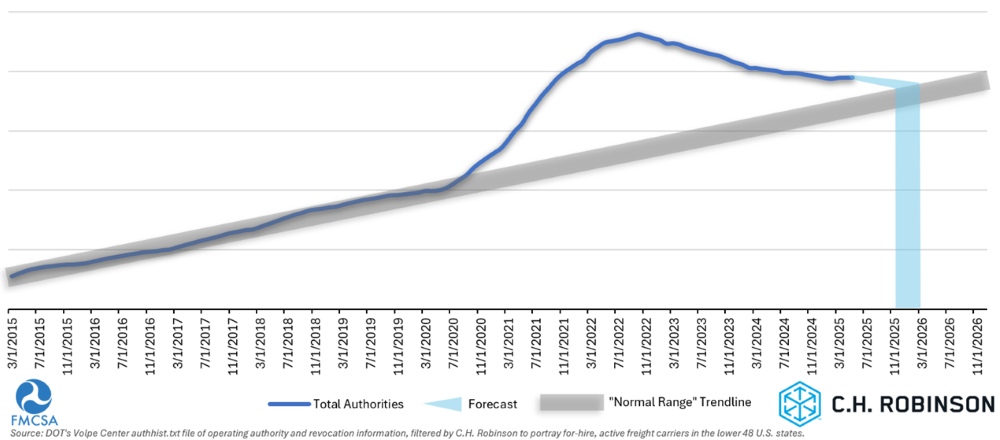
The number of carriers with authority to operate slightly increased in May for the second consecutive month. This is likely due to produce and beverage seasons bringing more freight to the market. With rates expected to soften in the third quarter, carrier attrition is likely to resume.
Contract truckload environment
The following insights are derived from C.H. Robinson Managed Solutions™, which serves a large portfolio of customers across diverse industries.
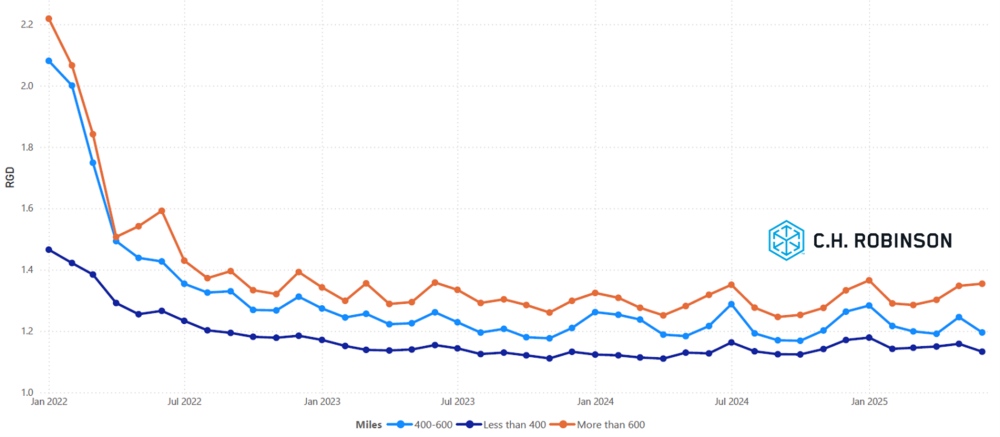
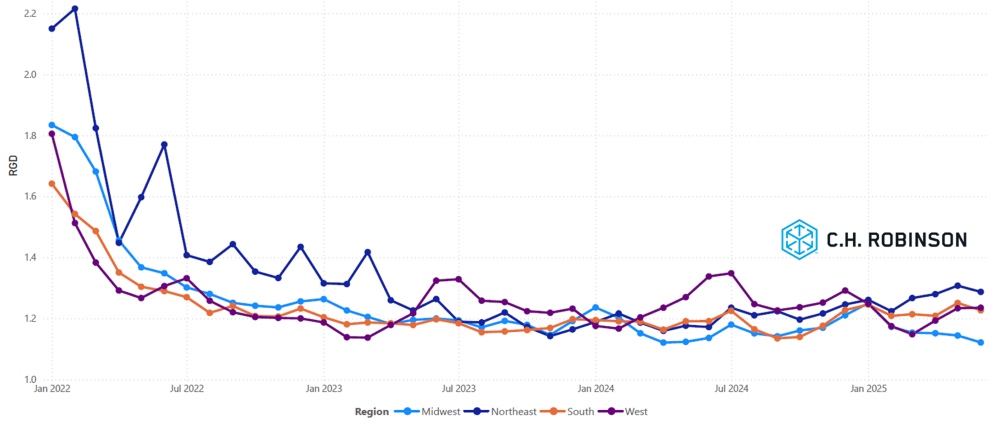
Route guide depth is an indicator of how far a shipper needs to go into their backup strategies when awarded transportation providers reject a tender. A depth of 1 would be perfect performance and 2 would be extremely poor. As displayed in the following chart, route guide depth has remained flat at a historically low level for approximately two years.
For the month of June, route guide depth across all U.S. regions and shipments was 1.21, a slight improvement compared to the previous month of 1.23.
From a mileage perspective, long hauls of more than 600 miles had a route guide depth of 1.35 in June—the same as May 2025 and slightly worse compared to June 2024, which was at 1.32. The trend for shorter hauls of less than 400 miles is similar. Route guide depth for June 2025 on these shorter hauls was 1.13, which is slightly better than the previous month of 1.16 and the same as June 2024 at 1.13.
North America route guide depth metrics: Miles
Geographically, the western United States experienced the least change of all regions, remaining even from the previous month, while the Midwest experienced the largest change, improving by 2%.
U.S. route guide depth metrics: Regions
Refrigerated truckload
East Coast United States
Produce volumes in the Southeast are currently coming off their seasonal peak, driven by strong Fourth of July demand. The highest shipping volumes are being recorded out of South Georgia and North Florida. Additionally, early harvests from farms in the Carolinas are beginning to contribute to overall regional output. Watermelon shipments are a major driver of activity, with C.H. Robinson moving approximately 450 loads weekly from the region.
The refrigerated freight market across Georgia has experienced significant capacity constraints, with load-to-truck ratios peaking at 30:1 or higher in rural areas of the state. Capacity tightness is being compounded by elevated freight volumes, making rate pressure the most significant challenge for shippers at this time. According to data from Circana, produce sales have increased by 2.3% from the prior year. Georgia has seen a strong growing season this year, and the higher volumes have added strain to outbound capacity.
Market conditions are expected to shift quickly in the coming weeks, since the Fourth of July is behind us and produce and beverage seasons are starting to wind down to Labor Day. As South Georgia's harvest wraps up, volumes will transition north into the Carolinas, where harvests will continue for roughly another month.
Central United States
The North Central and Great Lakes regions, leading into and immediately following the Fourth of July, observed some mild disruptions that impacted cost and coverage. These conditions were consistent with seasonal expectations and have stabilized since. Looking ahead, these geographies are expected to see steadily tightening conditions through August as produce season transitions into key areas such as southern and central Illinois, Indiana, and Michigan.
In the South-Central United States, market behavior has largely aligned with typical seasonality around the holiday period. Shipments with limited lead time or other challenging attributes faced elevated costs and coverage constraints. However, these pressures are expected to ease by mid-July, with quieter market conditions projected to continue through the remainder of the summer, barring any unforeseen disruptions ahead of the fourth quarter.
Western United States
Northern California is currently in the midst of peak produce season, with strong volumes of strawberries and mixed vegetables expected to continue throughout the summer months.
In Nogales, Arizona, increased shipments of watermelons and grapes are tightening capacity and driving up transportation costs. In the wake of the Fourth of July holiday, conditions began to improve, as harvest of these commodities began transitioning to other growing regions.
The Pacific Northwest is currently experiencing ample capacity. While minor disruptions are expected to continue in July due to the start of Washington’s cherry season, the main challenge in the region is elevated inbound transportation costs caused by limited outbound volume.
Overall, regional capacity across the western United States is expected to follow typical seasonal patterns in July, with rate relief occurring through most of the month.
Flatbed truckload
Market conditions for flatbed trucking have remained relatively stable. One exception is the Mid-South—including Texas, Oklahoma, Louisiana, and Arkansas—where tightening continues due to a mix of project freight and rising summer demand.
Regional fluctuations like this are common during the summer months and are expected to persist as project activity and heat-sensitive sectors ramp up.
From an economic standpoint, signals remain mixed. Residential construction continues to cool, which is a potential drag on building materials. Conversely, slight increases in manufacturing and trade inventories suggest stabilization in some industrial sectors, which could support steady baseline demand.
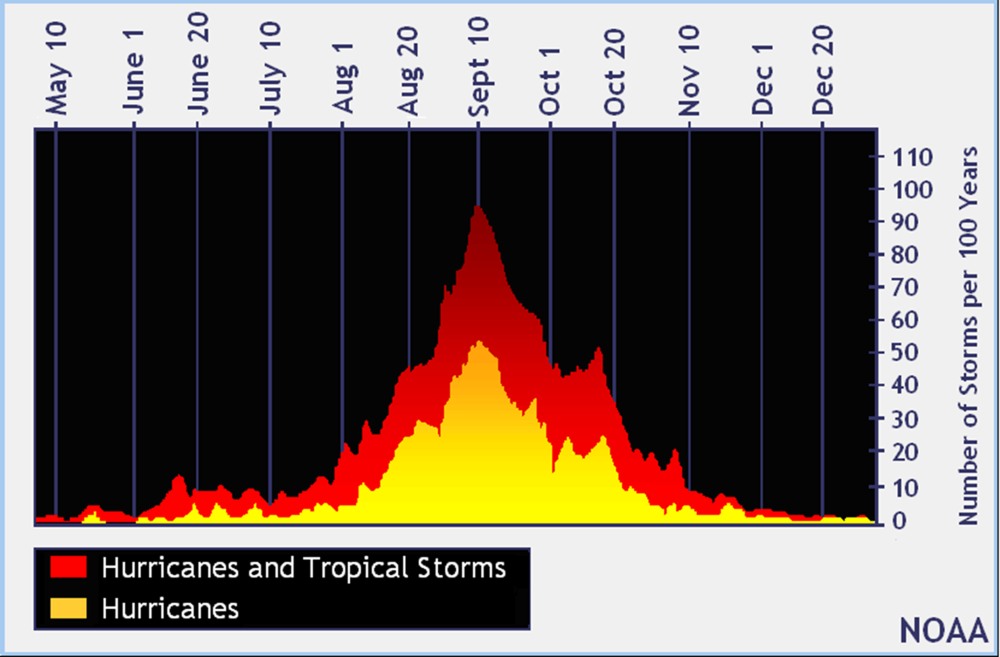
Hurricane season is now under way. While the peak typically occurs between September and October, visualized by the National Oceanic and Atmospheric Administration in the chart below, severe storms earlier in the season can still shift regional capacity and create short-term volatility.
These weather-driven dynamics will be important to watch through Q3, particularly in coastal markets. While tropical storms can be disruptive to all freight modes, it is especially difficult for flatbed due to the building materials that must be hauled for reconstruction.
In general, the flatbed freight environment is tracking close to seasonal expectations, with demand shaped by a mix of economic uncertainty and regional opportunities. Market watchers should continue monitoring economic indicators, weather patterns, and infrastructure trends for potential shifts in the second half of the year.
Voice of the carrier
Observations from a cross-section of C.H. Robinson’s 450,000 carriers:
Market
- Many carriers have taken nearly all the steps they can to cut operating costs. Rate increases may need to occur to continue profitability.
- Overall deadhead miles continue to increase, due to fewer opportunities in the marketplace.
Drivers
- The pool of drivers remains plentiful, which continues to allow carriers to be selective in who they hire. Unseated equipment is rare and intentional when it does occur.
Equipment
- Medium-to-large carriers continue to make investments to ensure their fleets remain up to date.
- Because of tariffs, the availability and cost of parts and equipment is a concern.
 Actionable freight insights